

Condensed Interim Financial Statements For The First Half Ended 30 June 2025
Financials Archive![]() Note: Files are in Adobe (PDF) format.
Note: Files are in Adobe (PDF) format.
Please download the free Adobe Acrobat Reader to view these documents.
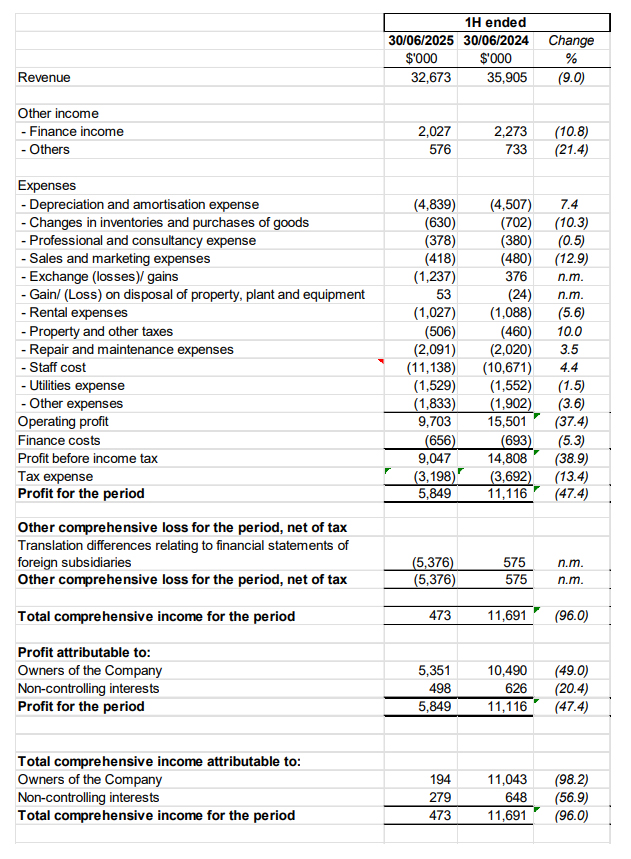
Condensed Interim Consolidated Statement of Profit or Loss and Other Comprehensive Income
Condensed Interim Statement of Financial Position

Review of performance of the Group
Revenue
In the first half of FY2025, the Group generated sales of $32.67 million, 9.0% lower than the corresponding period in 1H2024, mainly due to lower visitor arrivals to our China attractions, and partly the weaker Renminbi (“RMB”) currency which translated to lower revenue in Singapore Dollars (“SGD”), the reporting currency. Revenues generated by the three China attractions in total were about 13% lower than 1H2024 in SGD terms, while Singapore Flyer also reported a single-digit decline.
Overall visitation to all the attractions totalled 1.29 million visitors for the half year, 12% lower than the corresponding period of 1.47 million visitors in 1H2024.
Other income, including finance income, decreased below corresponding period, as bank deposit rates decreased; income from concessionaire sales and government grants received were also lower.
Operational Results
Total Expenses (excluding finance cost) for 1H2025 was $25.57 million, 9.2% higher than 1H2024. Exchange losses of $1.24 million was recorded in this period, as Renminbi currency weakened against the Singapore dollar in the current period compared to last year-end exchange rate; while exchange gains of $0.38 million was recorded in 1H2024. Excluding the exchange losses/ (gains) in both periods, total expenses would have been 2.3% higher than 1H2024.
Changes in inventories and purchase of goods decreased, as retail and F&B sales were lower. Sales and marketing expenses decreased, mainly due to lower advertising and promotional expenses, as well as lower service fee paid to ferry operators at Underwater World Xiamen as sales volume decreased. Gain on disposal of property, plant and equipment mainly arose from the trade-in of equipment. Property and other taxes increased 10% compared to corresponding period, due to the upward revision of annual value for the Giant Observation Wheel (“GOW”), retail units, and owned office units.
Profit before tax was $9.05 million for 1H2025, 38.9% lower than the profit before tax of $14.81 million recorded in 1H2024.
Balance Sheet items
Trade and other receivables decreased 15.7% from $3.71 million at 31 December 2024 to $3.13 million at 30 June 2025, mainly attributable to decrease in trade receivables, decrease in grant receivable arising from the receipt of previous year’s grant amount by Singapore Flyer, offset by increase in interest receivable from periodic recognition of interest income on fixed deposits placed in the current period.
Other current assets decreased 13.8% from $1.50 million at 31 December 2024 to $1.30 million at 30 June 2025, mainly due to advance payments for certain enhancement or system upgrading projects at Singapore Flyer being reversed upon completion.
Reserves decreased 60.5% from $8.15 million at 31 December 2024 to $3.22 million at 30 June 2025, mainly due to the translation loss of $5.16 million arising from the weaker RMB against SGD at the end of the current period compared to the end of last year, offset by increase in share option reserves arising from the share option expense recognised for options granted in May 2024 and May 2025.
Non-current trade and other payables increased 20.7% from $0.31 million at 31 December 2024 to $0.37 million at 30 June 2025, mainly due to security deposit received from a new F&B tenant for a three years lease.
Deferred income decreased 11.4% from $0.20 million at 31 December 2024 to $0.18 million at 30 June 2025, mainly due to the addition of asset-related grants received by Singapore Flyer, offset by periodic recognition of deferred income to profit & loss in the current period.
Current trade and other payables decreased 18% from $10.42 million at 31 December 2024 to $8.55 million at 30 June 2025, mainly due to decrease in other payables arising from performance bonus and certain expenses accrued in last year being paid in the current period; offset by increase in trade payables arising from annual insurance premiums payable upon renewal.
Current tax liabilities increased 30.6% from $1.46 million at 31 December 2024 to $1.91 million at 30 June 2025, mainly due to net increase arising from the provisions of income taxes for 2Q2025 offset by payment of 4Q2024 income taxes provided in FY2024 by our profitable China subsidiaries in the current period; offset by instalment payments of YA2024 income taxes by HQ and Singapore Flyer.
Cash Flow Statement
The Group reported net cash of $11.28 million generated from operating activities for 1H2025, a 16.8% decrease compared to net cash generated of $13.56 million in 1H2024. Purchase of property, plant and equipment of $3.33 million in 1H2025, significantly higher than 1H2024, were mainly the construction-in-progress for the Phase 2 development of Time Capsule and painting work of the Giant Observation Wheel; as well as hardware equipment and software related upgrades or purchases. Final dividend of 1.5 cent per share and special dividend of 0.5 cent per share in respect of FY2024 was paid out to the Company’s shareholders in the current period. Repayment of borrowings in 1H2025 amounted to $0.53 million for the 5 years temporary bridging loan taken up by Singapore Flyer in 2021.
As at 30 June 2025, the Group’s cash and cash equivalent balance amounted to $172.31 million.
Commentary
The National Bureau of Statistics of China reported that China’s gross domestic product (“GDP”) grew 5.3% year-on-year in the first half of 2025, demonstrating resilience, stability and potential for long-term improvement. Domestic demand was the primary driver of economic growth in 1H2025, while employment and consumer prices remained generally stable. On the tourism sector, apart from the domestic travel remaining strong, there was also a surge in foreign tourists in the first half of 2025, as China expands its visa-free policy for tour groups for more countries.
Singapore’s GDP growth averaged 4.2% year-on-year in the first half of 2025, according to advance estimates released by the Ministry of Trade and Industry. On the tourism sector, the Singapore Tourism Board (“STB”) reported that Singapore received 8.33 million visitors in 1H2025, up 1.9% year-on-year to 89.4% of 2019 pre-Covid-19 level. While acknowledging potential headwinds stemming from geopolitical tensions and macroeconomics challenges, STB remains focused on driving quality tourism growth, and will continue to welcome new attractions and experiences.
![]()